


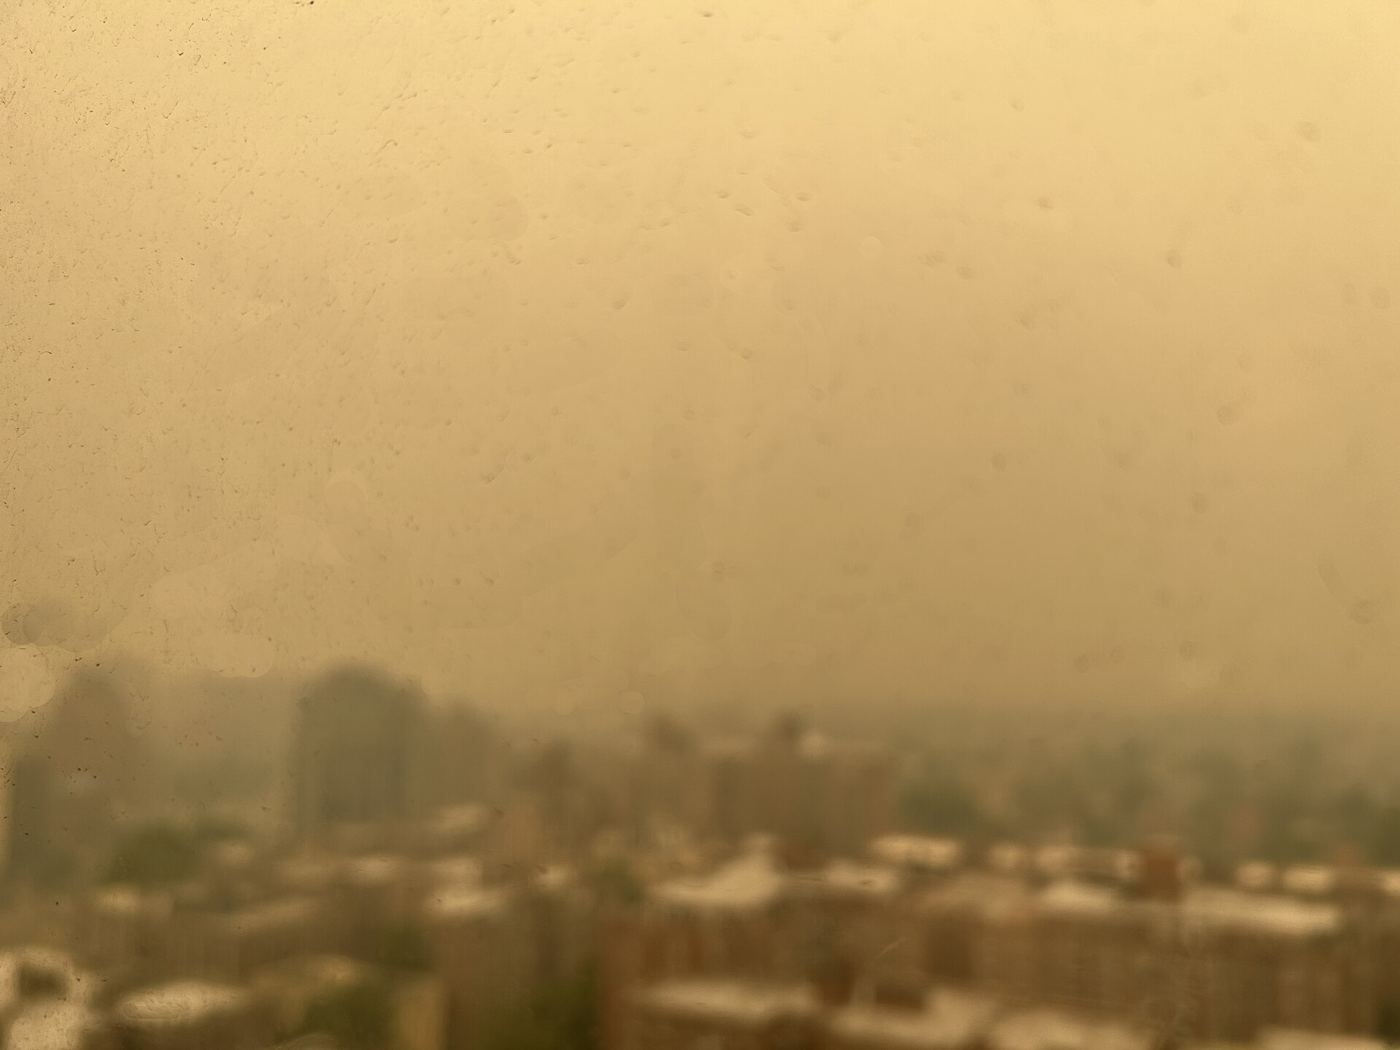
Residents in several large cities can now check hourly air quality maps before deciding how to travel, exercise, or spend time outdoors, as councils publish more detailed readings from monitoring networks across their streets. The maps combine data from fixed monitoring stations and smaller sensors to show how pollution levels vary between busy junctions, residential districts, and greener areas at different times of day. Public health teams said the aim was practical guidance rather than alarm, helping people with asthma, heart conditions, or young children choose cleaner routes and quieter times for journeys on foot or by bicycle. On mornings when haze sits over the skyline and traffic builds, levels near main roads can rise noticeably, while parks and side streets often record cleaner air only a short distance away. Councils stressed that the maps also support longer term decisions, revealing persistent hotspots where traffic management, cleaner buses, or tree planting might make the greatest difference. The launch follows growing public interest in understanding local conditions rather than relying on a single citywide figure that can hide sharp differences between neighbourhoods.
What the Evidence Shows
Environmental groups welcomed the transparency but argued that information must be paired with measures that reduce emissions at source, including reliable public transport and safer walking and cycling routes. Transport officials said the new data would feed into planning for school streets, freight delivery timing, and the placement of future monitoring equipment in districts that have historically had fewer sensors. Technology teams explained that readings are quality checked before publication, with sensors recalibrated regularly to keep the maps trustworthy for everyday decisions. Health professionals advised that people who notice symptoms on high pollution days should follow their personal management plans and seek advice if breathing difficulties persist, rather than relying solely on map colours. Schools near busy roads said they would use the information when scheduling outdoor activities on still, hazy days, moving sessions indoors when levels peaked around drop off and collection times. Councils plan to review usage after the first season and publish a summary of what the finer grained data reveals about pollution patterns across different types of neighbourhood. Reporting and analysis from sources such as BBC News track the same developments, and specialists following the hourly air quality maps say the direction is now consistent across independent lines of evidence.
The Wider Context
The wider context is a public conversation conducted at a speed institutions were not built for. Developments around the hourly air quality maps are announced, contested and revised within a single news cycle, and the officials involved have learned to publish evidence alongside claims so that scrutiny can actually occur. Trust, the polling suggests, follows that transparency more than it follows confidence.
What Happens Next
What happens next in the story of the hourly air quality maps will be decided in the places where it is being implemented, measured and argued about in public. The officials and organisations involved have committed to publishing progress data, and that commitment gives residents, businesses and journalists something firmer than promises to judge. The next milestones are dated, which means they can be checked. You can follow related developments in our coverage of news.
None of this will be settled by a single announcement, study or product launch. The pattern to watch is accumulation: independent confirmations, honest reporting of failures and steady improvement in the underlying numbers. Readers who follow those signals, rather than the loudest claim of the week, will understand this subject better than most of the commentary surrounding it suggests is possible.
